
Guardiola gave Erling Haaland 84 minutes a game. Will Maresca?
A player takes his scoring touch with him wherever he goes. His minutes belong to whoever picks the team, and that is the half you can look up before draft day.
Daniel James was playing 76 minutes a game at Leeds and scoring 6.6 fantasy points a night. Then Daniel Farke took over, and James dropped to 2.4. Same player, same club, and just as sharp while he was out there. He was simply out there for 28 minutes instead of 76. Farke is still his manager this season.
That is your player’s season in one line. James did not get worse. He got less of the game, and how much of the game a player gets is settled by somebody who is not in your league.
Is it the player, or the minutes?
James is one case, so here is every one of them. Since 2020, 372 players have appeared at least 15 times under one manager and 15 more under the man who replaced him, at the same club. Each is a dot below, with what happened to his minutes along the bottom and what happened to his points up the side. Nobody moved club, so nothing else is doing the work. The line is not fitted to the dots: it is what a player would score if his minutes changed and nothing else did.
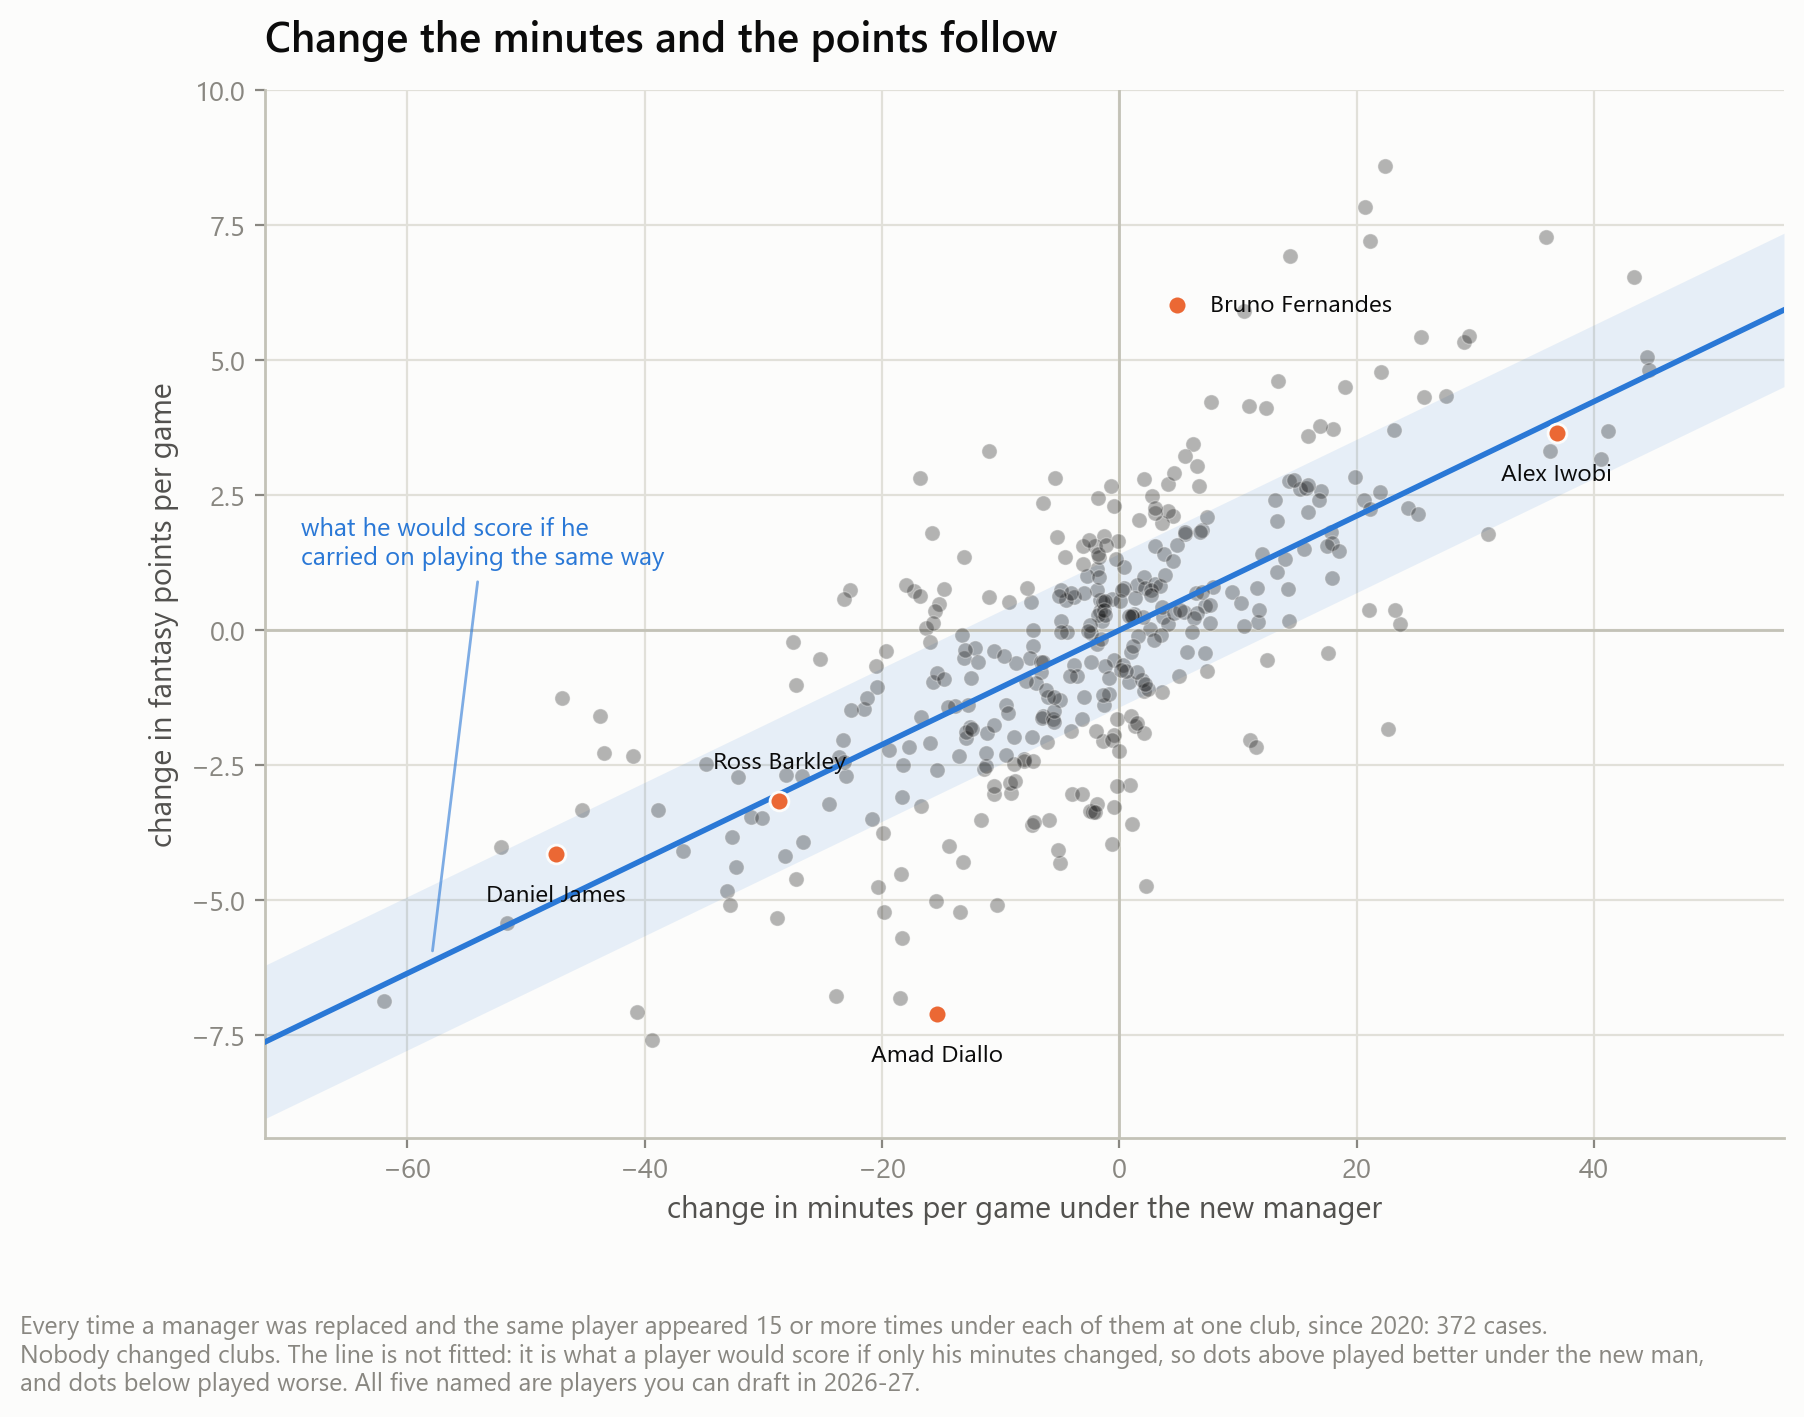
The dots track that line, which is what it looks like when the scoring holds and the minutes do the moving. Alex Iwobi is James in reverse: 52 minutes a game at Everton became 89 under Frank Lampard, and 4.9 points became 8.5.
So keep his scoring rate and redo his minutes. That beats assuming nothing changed 68% of the time. It is not everything, mind. Michael Carrick took over at Manchester United and Bruno Fernandes went up 6 points a game while Amad Diallo went down 7, and most of Diallo’s fall had nothing to do with minutes. That is the part nobody can call in advance.
So where do you find the minutes?
Find it in how many changes the manager makes. There are 900 minutes of outfield football in a match, and the more players he uses, the fewer each of them gets.
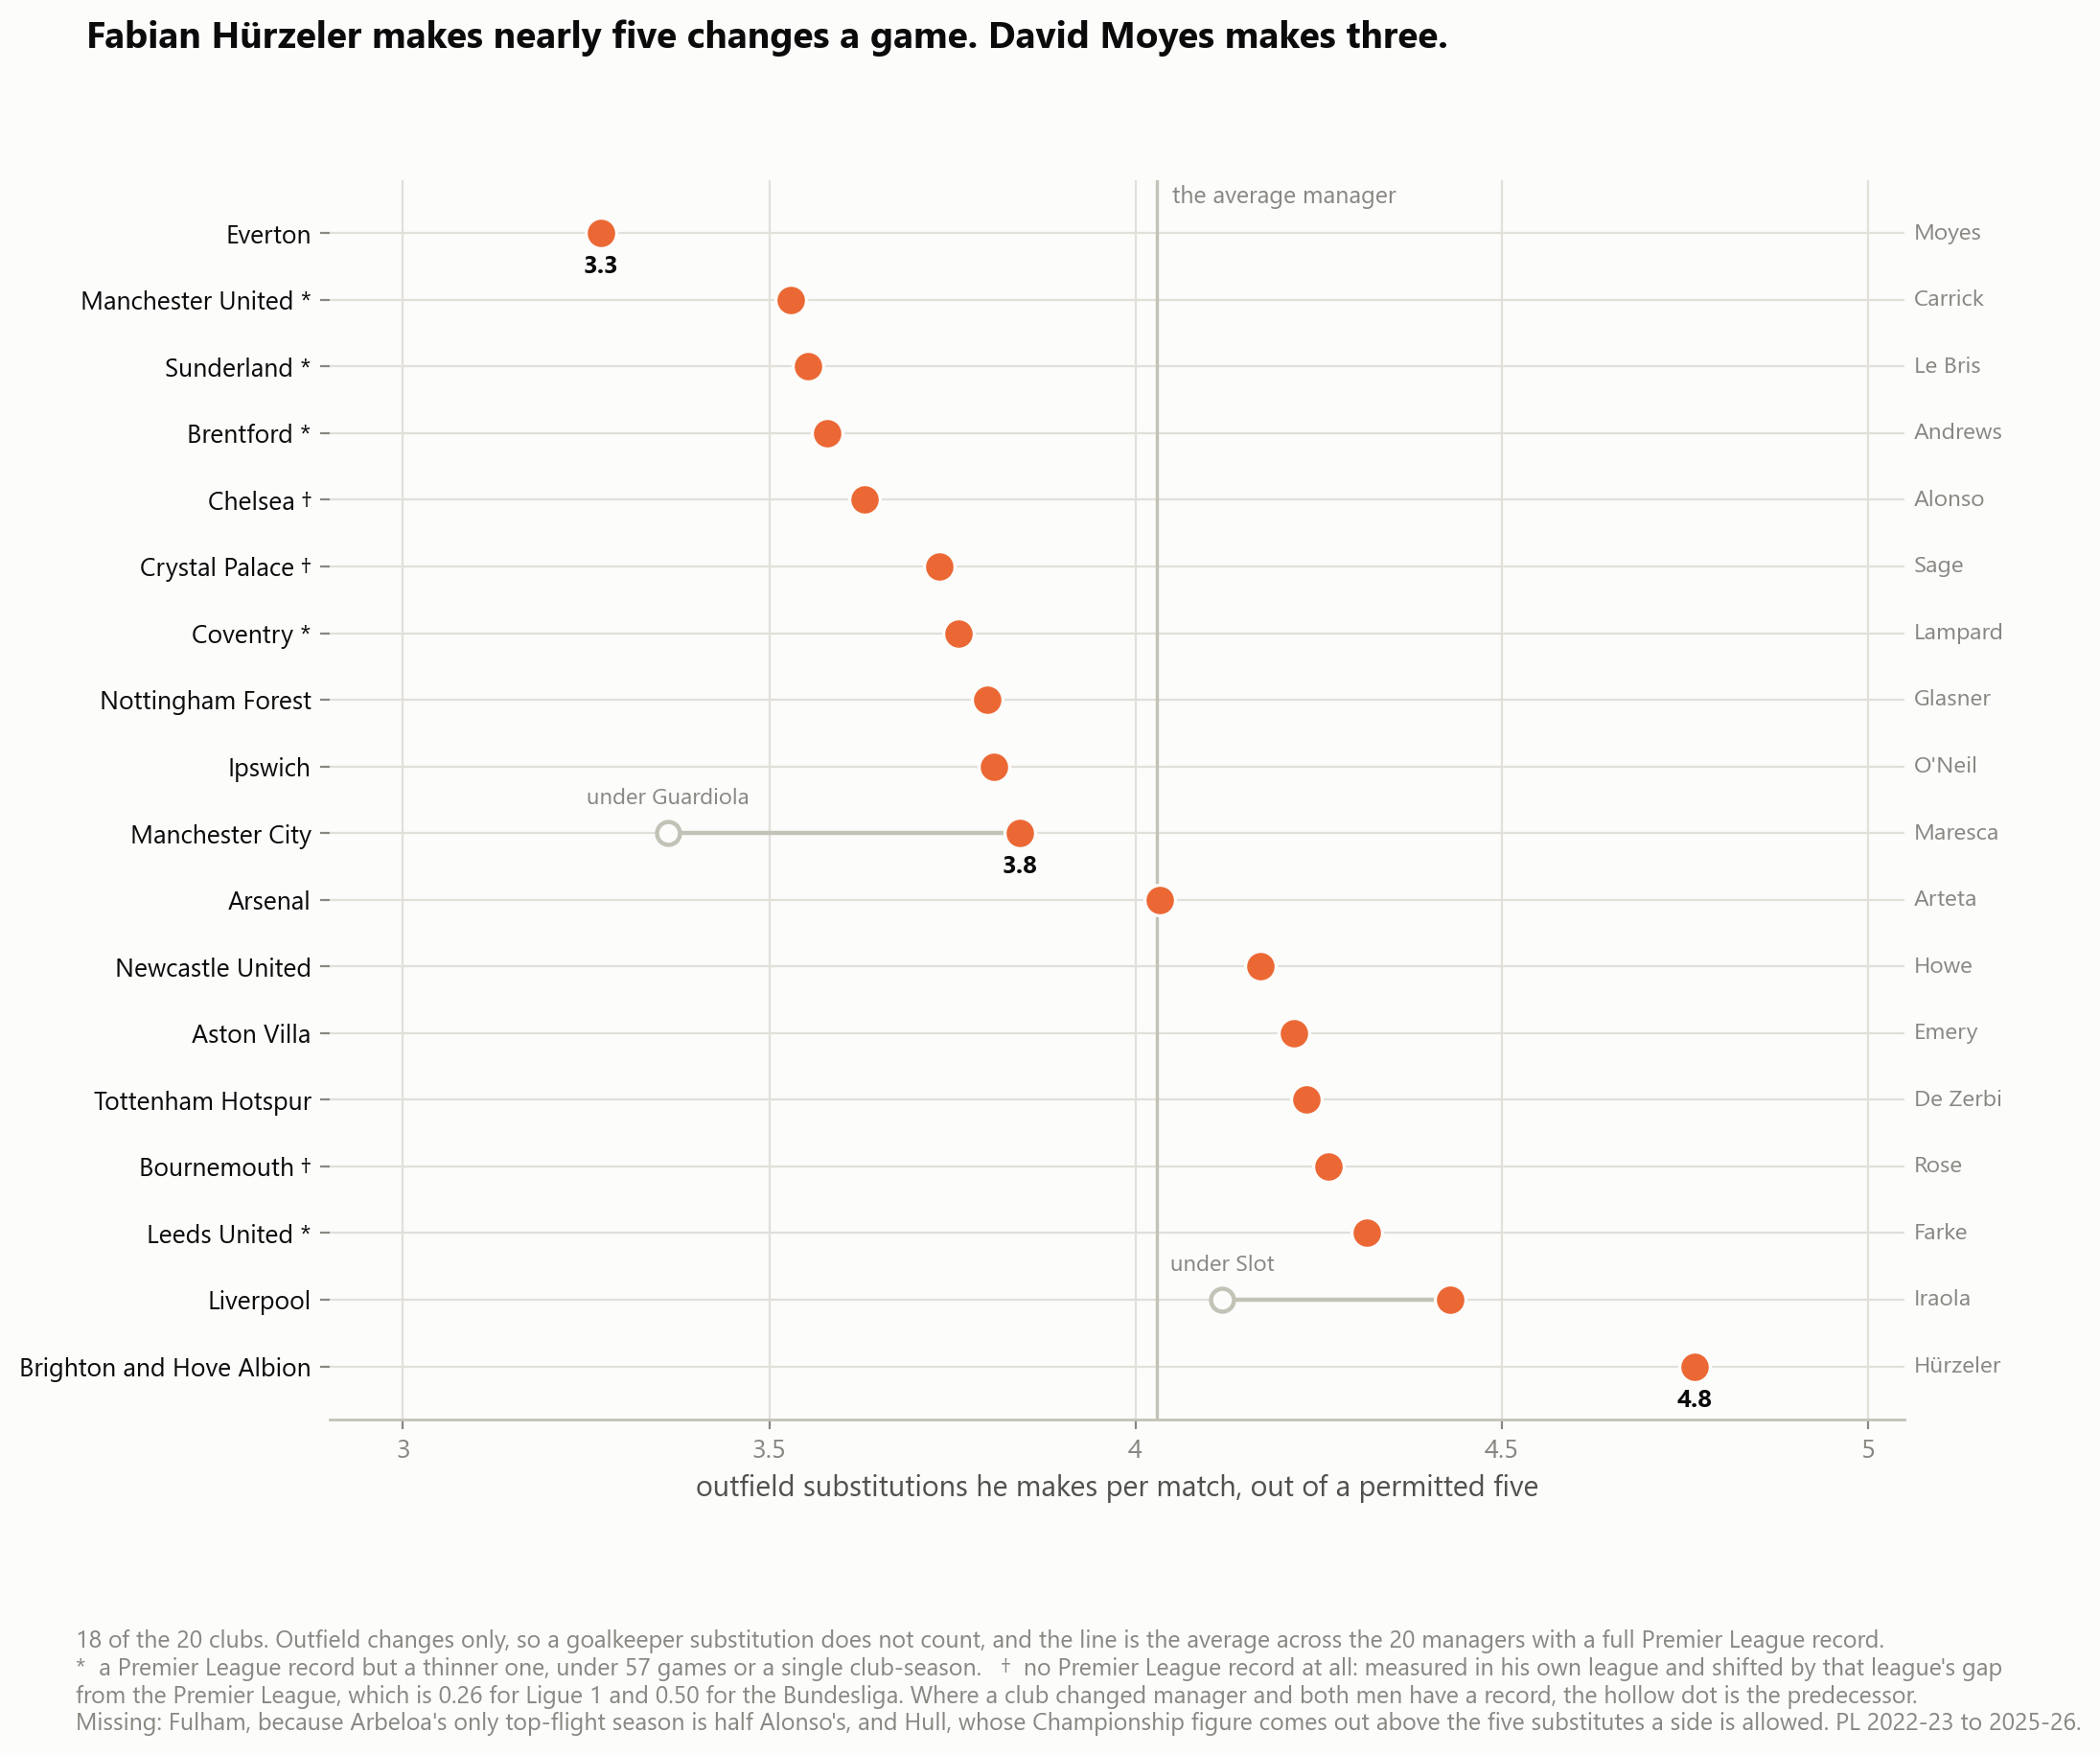
Eighteen of the twenty clubs, and how freely each manager reaches for the bench. David Moyes makes 3.3 changes a game and Fabian Hürzeler nearly five, which is seven minutes a game between them for the average player. The marked clubs are the ones where the evidence is thinner, and the hollow dots are the two changes where the man who left has a record too. It travels, though: a manager’s own record beat the rest of the league’s as a guide to his next season, cutting the error by a fifth. A lookup, not a guess. And it is not a rich list in disguise: how good the squad is barely moves the order, which is why City sit in the middle of it.
Two clubs are not on the chart. Fulham is a technicality and the key explains it. Hull is the interesting one: it came up through the playoffs and Sergej Jakirović has never managed here, so there is nothing to plot. Last season, his players got less of the game than any other club in the Championship. Dragging that number up a division needs three corrections and they disagree enough that any dot would be a guess. The direction survives: draft a Hull player and expect a manager who makes changes.
So who do you draft?
Eight clubs had the same manager for all of last season, and there the draft has already seen the minutes. At the other twelve the price was set at least partly by a man who has gone. Tottenham look like an exception and are not one: De Zerbi has the job, but he only took it in April, so last season’s Spurs numbers are mostly Thomas Frank’s, and the two of them make the same number of changes anyway.
Both changes cut the same way. Guardiola made 3.4 changes a game and Maresca makes 3.8; Slot made 4.1 and Iraola makes 4.4. Neither is dramatic alone, but both point down, and they land on the three most expensive names on the board: Erling Haaland goes at an average draft position of 2, Dominik Szoboszlai at 5, Florian Wirtz at 7. Those prices were set by a season somebody else picked the team for. Maresca also has the thinnest record on the chart, two seasons at Chelsea, so City is the one to hold loosest.
Buy Everton, because nobody else wants to. Moyes uses fewer players than any manager in the league, so an Everton starter finishes games that other clubs’ starters do not. James Tarkowski goes at an ADP of 27 and James Garner at 25, which is what an unfashionable club costs.
Pay full price at Brighton and know why. Hürzeler makes nearly five changes a week, the most of anyone still working. Pascal Gross has an ADP of 40 and Yankuba Minteh 42, and neither is underrated. You are buying good players at a club that shares the game out.
Premier League league matches, outfield players, Fantrax scoring. A case counts when a player made 15 or more appearances under the manager before a change and 15 or more under the one after, at the same club, so no transfer is doing the work: 372 cases across 265 players, 2020-21 to 2025-26. The substitutions chart starts at 2022-23, when the league went from three substitutes to five, because that change alone moved the average appearance by nearly eight minutes and managers either side of it are not comparable. It covers 18 of the 20 clubs at three grades of evidence, marked on the chart: a full Premier League record, a thinner one, or no Premier League record at all, in which case the manager is measured in his own league and shifted by that league’s gap from this one. Fulham and Hull are left off, for reasons the chart’s key gives. These are minutes and points players actually produced, not a projection of anyone’s next season.