

Harry Wilson left Fulham after the best season of his career: 10 goals, nine assists and 341 fantasy points. He finished as the 29th top scorer among outfield players, and 13th among midfielders. Now at Leeds, he’s being drafted 51st.
So is Wilson undervalued this season? Six seasons of transfer data can help answer that.
He isn’t playing worse. He’s playing less.
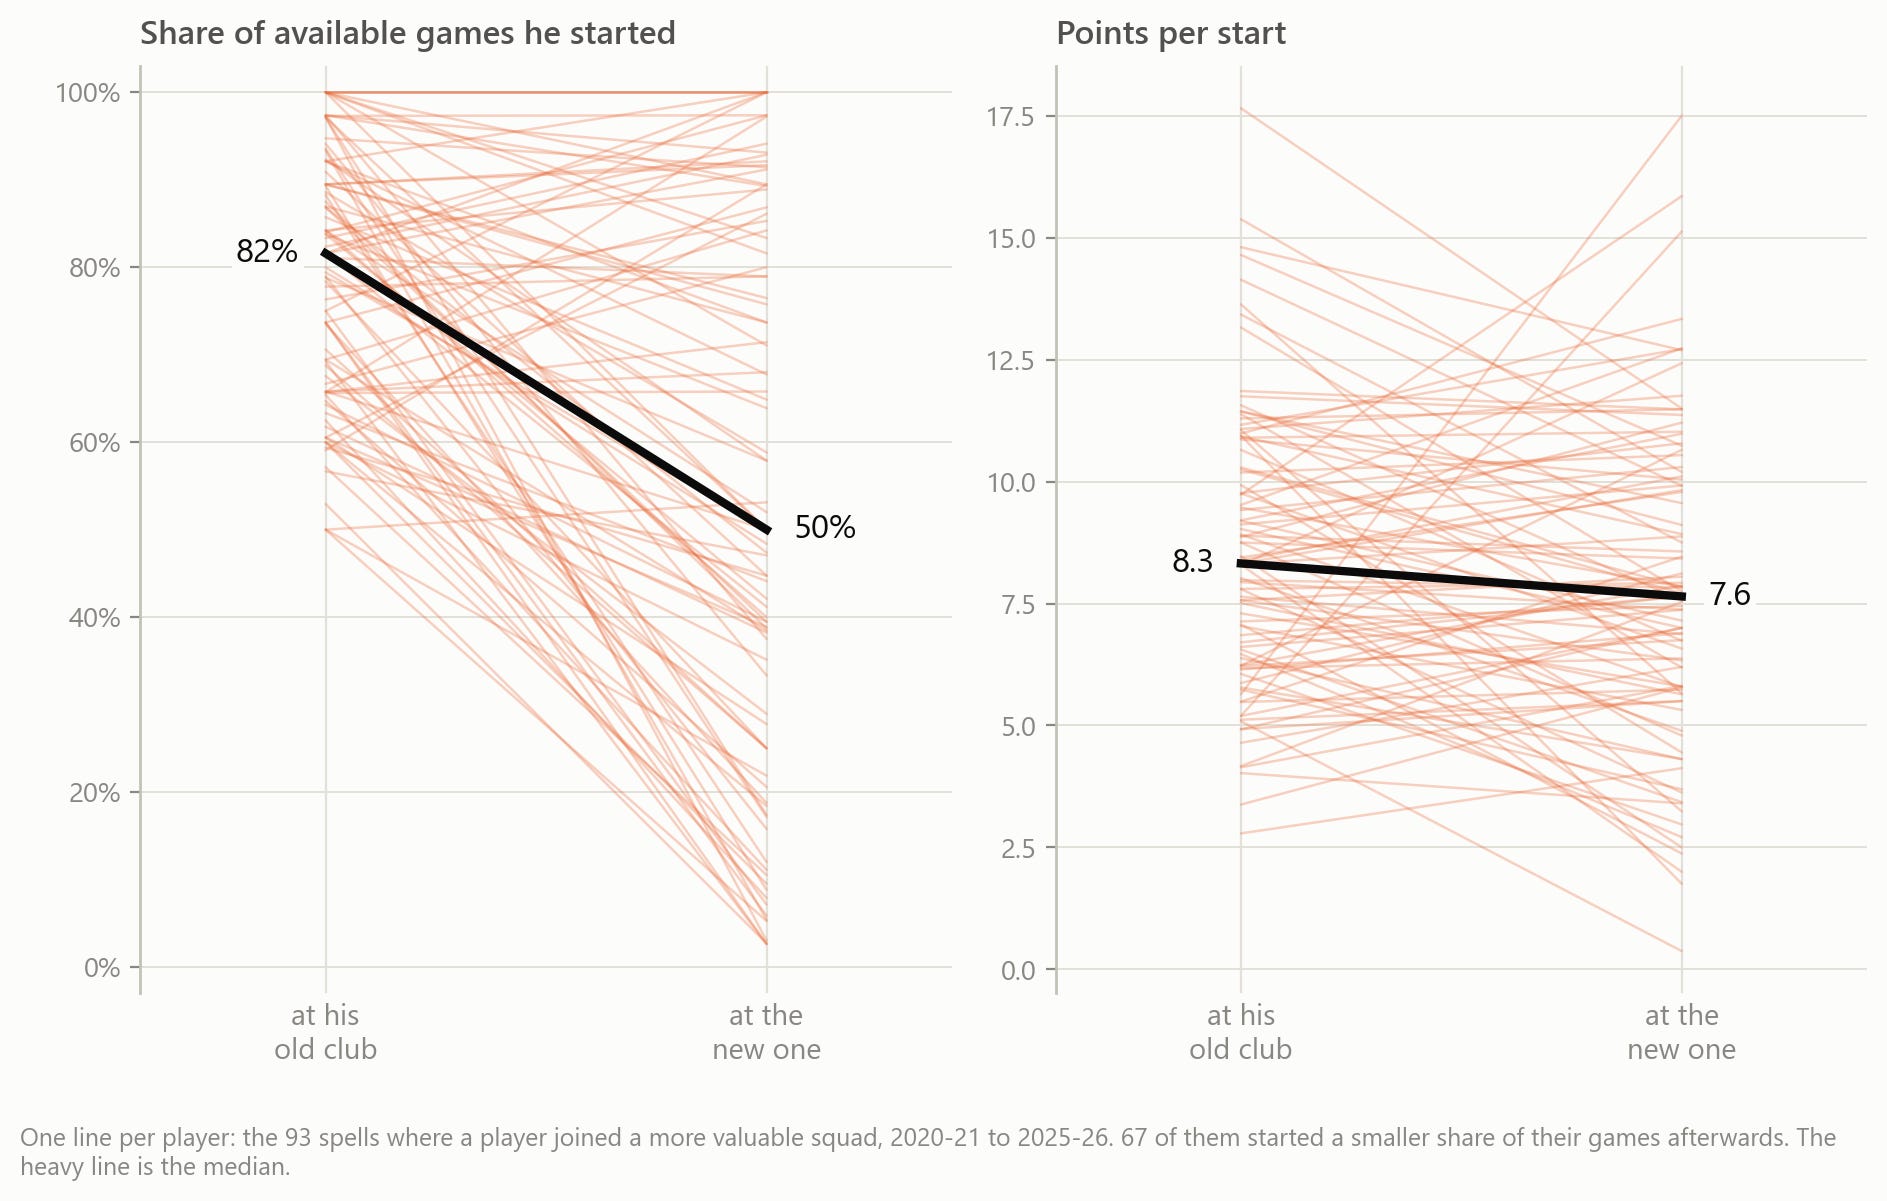
Each line is one player, from his old club to his new one. On the left is the share of the games he was available for that he actually started. 72% fall. On the right is what he scored in each start he did make, and it goes from 8.3 points to 7.6. One number collapses and the other barely moves.
So what decides how many of those starts he loses?
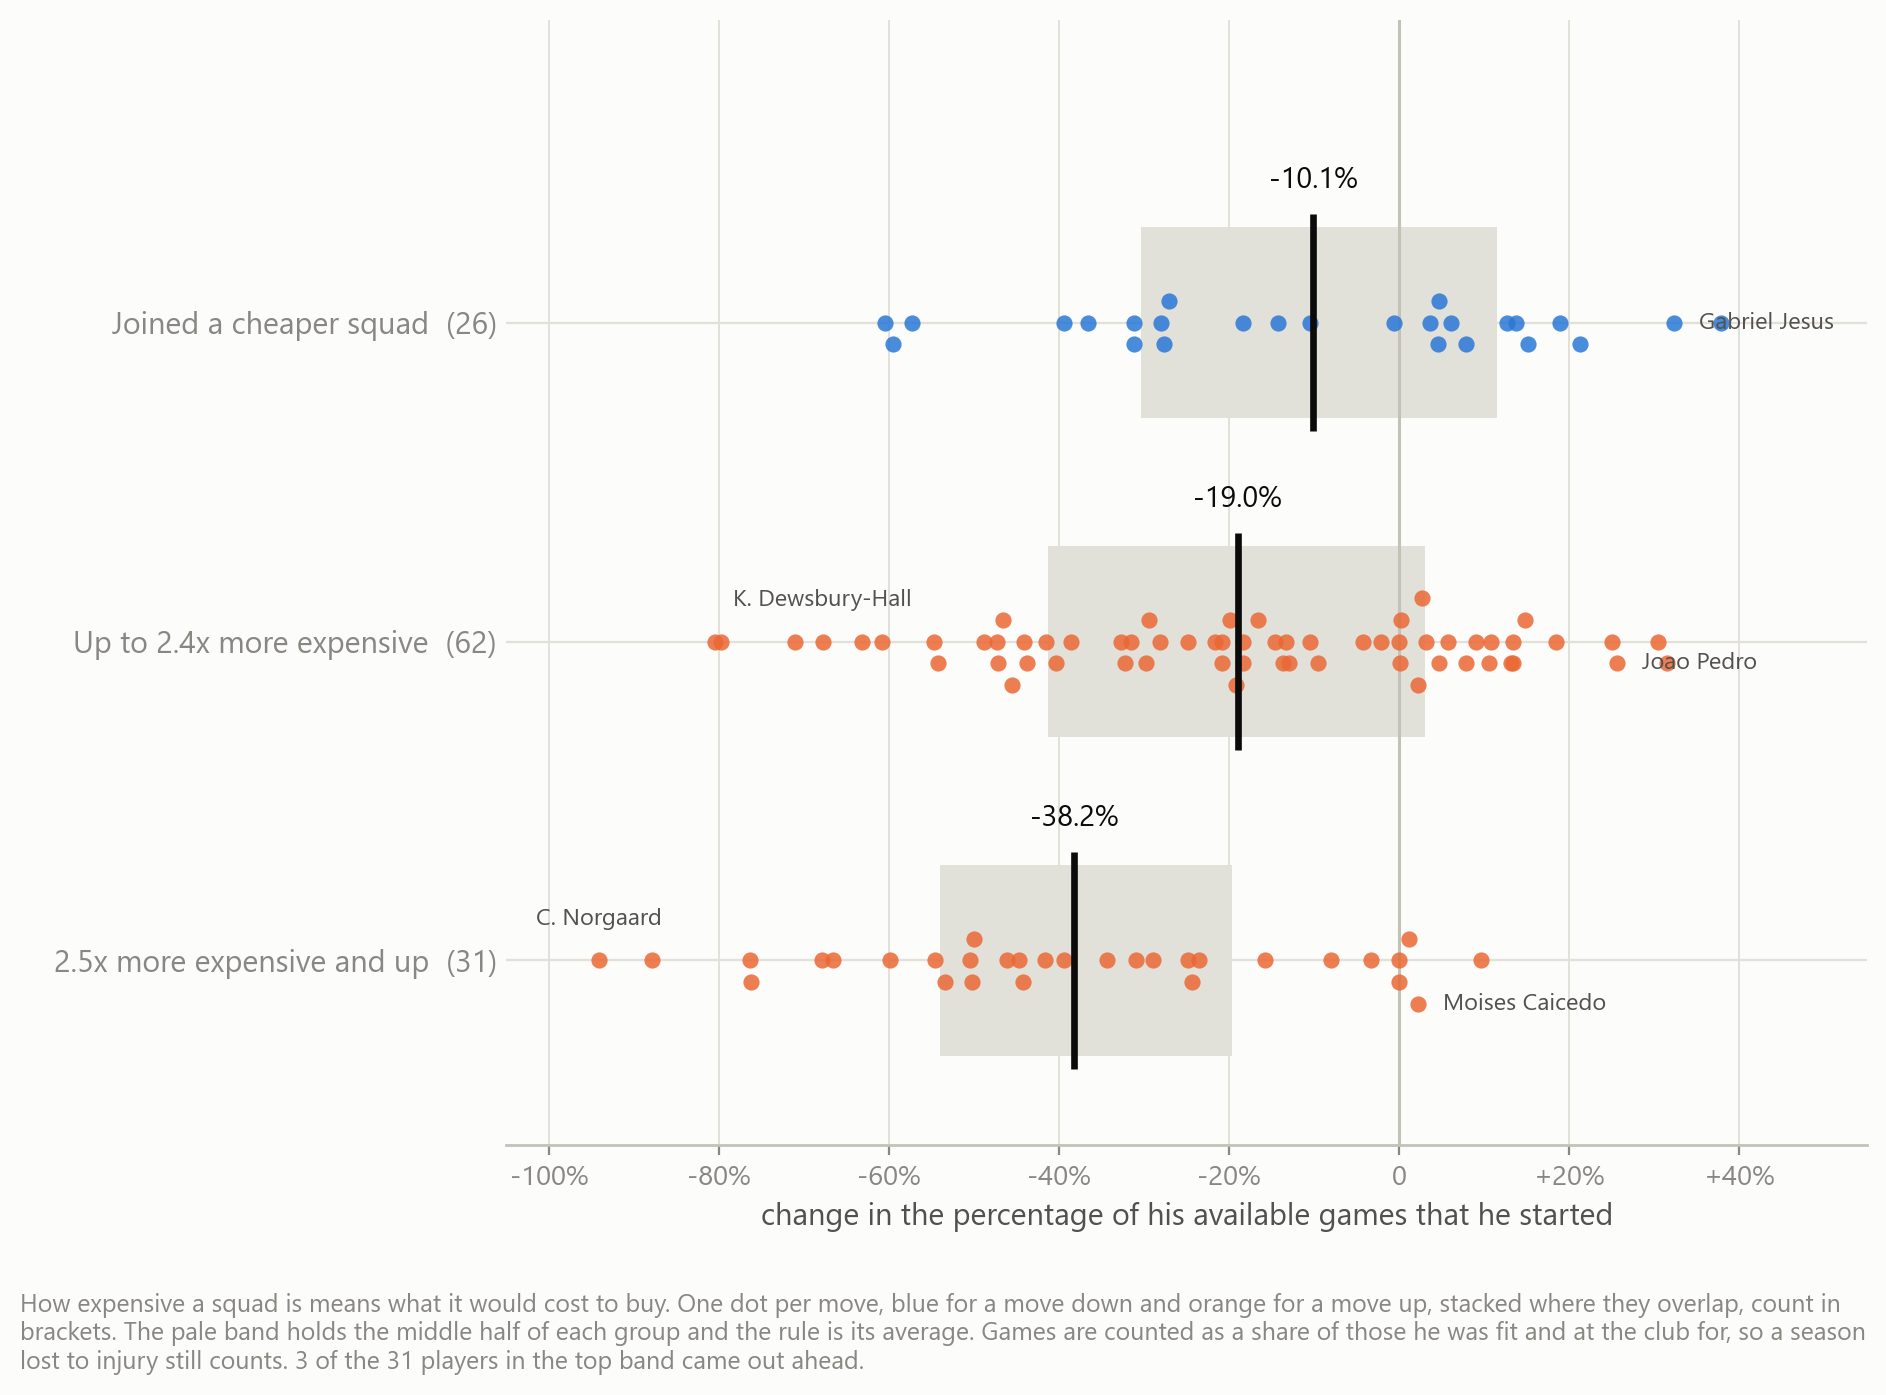
What the players around him are worth. Not where his new club finished, because a table only ever says higher and never how much higher, but what its squad costs. Each row here is a band of that, and each dot is one move.
Join a cheaper squad and the share of games he starts falls by 10%. Join one up to two and a half times as expensive and it’s 19%. Join one dearer than that and it’s 38%.
The pale bands are where the middle half of each group sits, and they say how little of this is a rule. Two of them still reach past zero: 46% of the players who dropped a level came out ahead, and 32% of those who moved up did too. Only the bottom row separates, and only just, at 10%.
Who has moved, and how far?
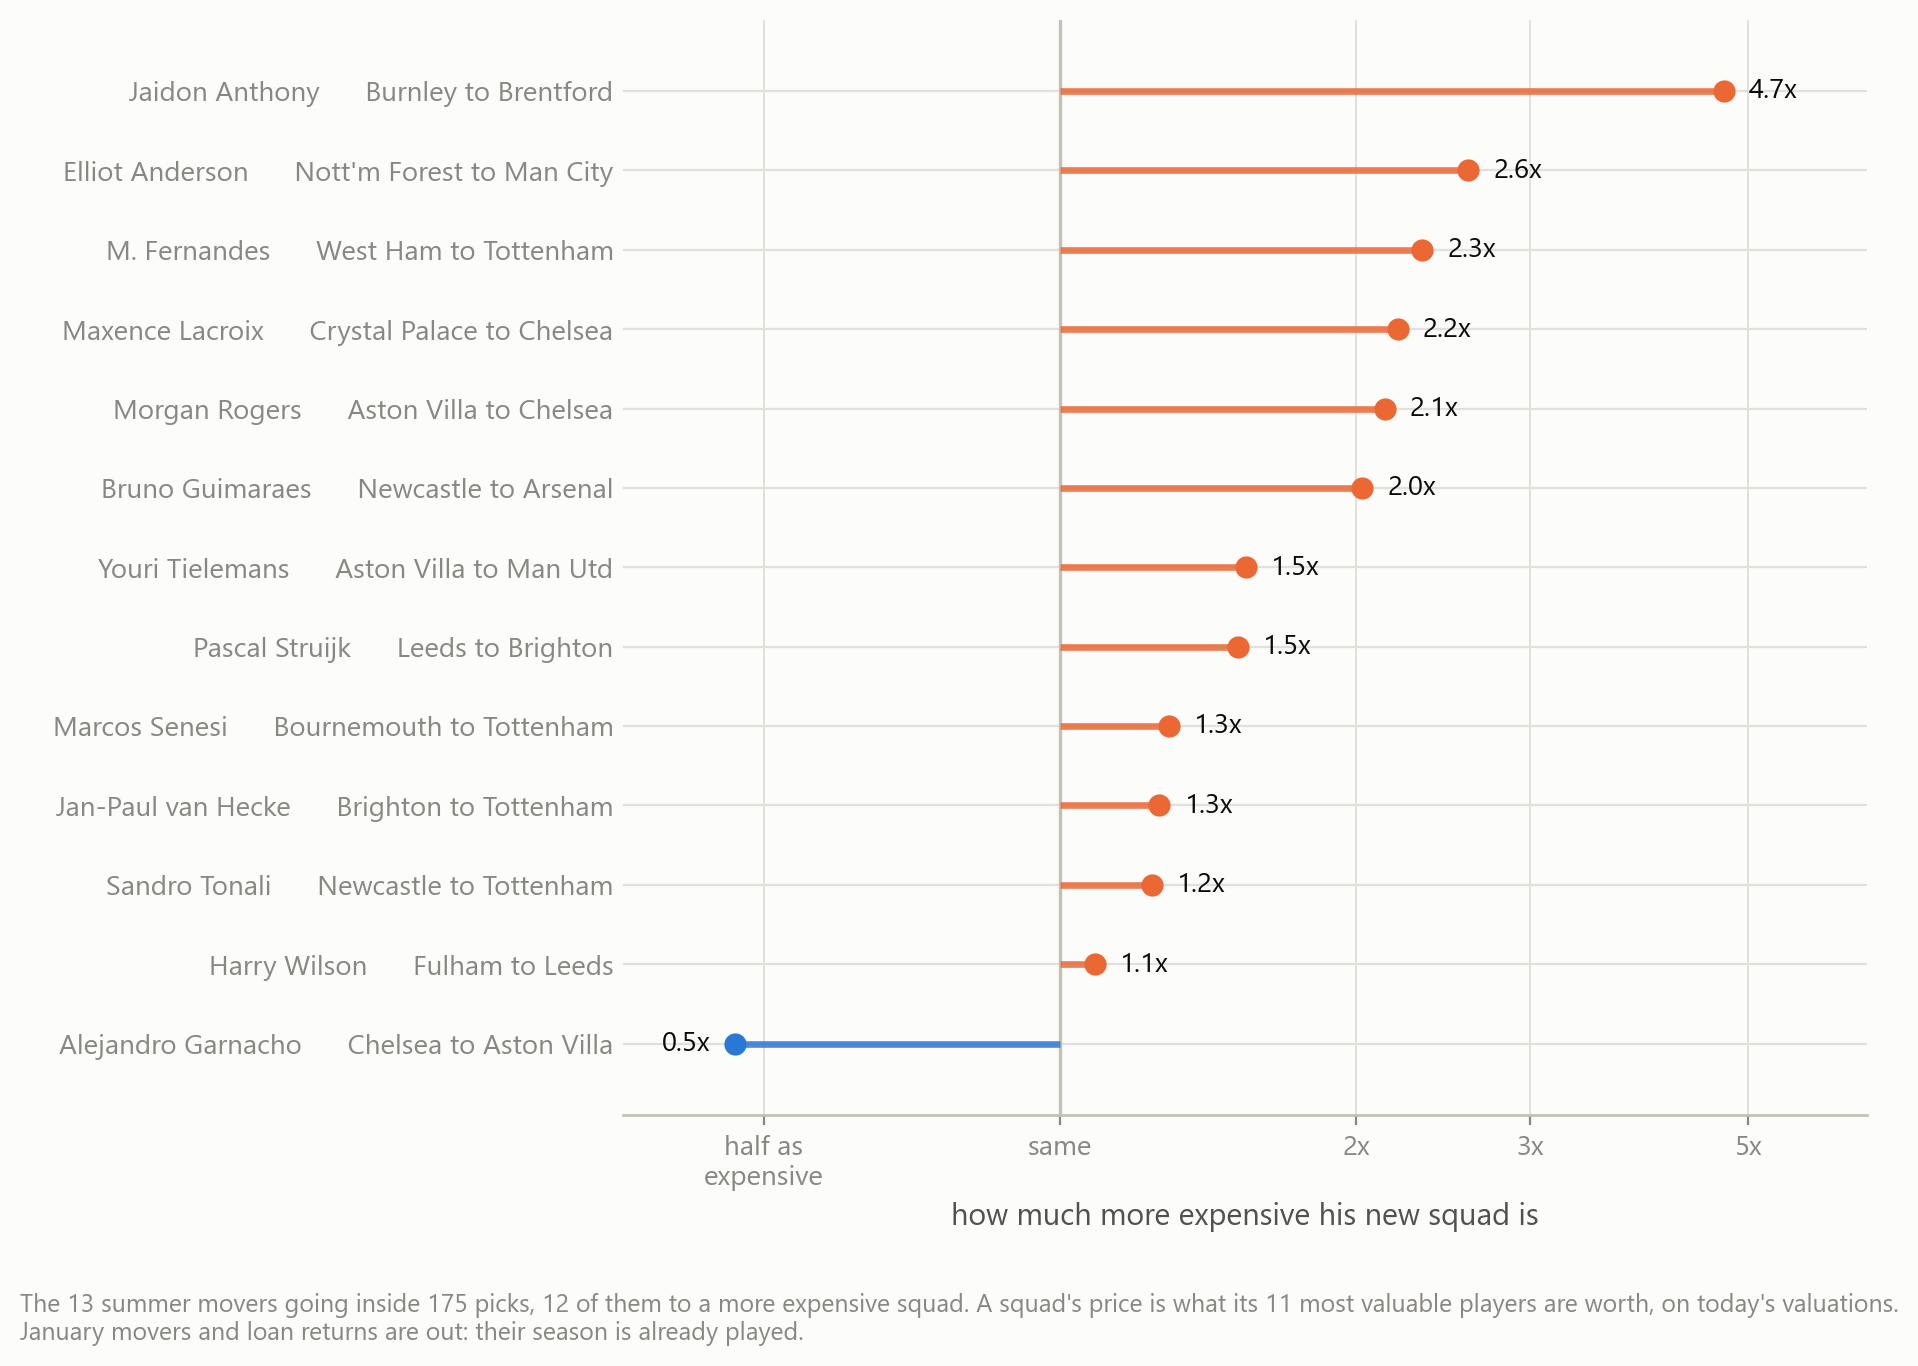
These are the 13 players going inside the first 175 picks who changed clubs this summer, and how much more expensive the squad each of them joined is.
12 of the 13 moved up. Jaidon Anthony’s is the extreme, Burnley to Brentford at almost 5 times, and only Alejandro Garnacho went the other way. Harry Wilson’s is the shortest step up of the lot: on today’s valuations Leeds and Fulham cost within a tenth of each other.
The order doubles as a forecast. The bands above say the players at the top of this list are the ones whose starts are most at risk, and the players at the bottom the least.
So how does this impact your draft?
This isn’t a hard and fast rule. There are too many variables to draft based on this alone. Instead, use this as another piece of the puzzle.
Lose 0-1 starts
Harry Wilson
Sandro Tonali
Alejandro Garnacho
Lose 2-4 starts
Bruno Guimaraes
Marcos Senesi
Jan-Paul van Hecke
Pascal Struijk
Youri Tielemans
Lose 5-9 starts
Maxence Lacroix
Elliot Anderson
Morgan Rogers
Mateus Fernandes
Lose 10 starts
Jaidon Anthony
Premier League matches, outfield players, Fantrax scoring, 2020-21 to 2025-26, and only players who changed clubs: 119 moves, 93 to a more expensive squad and 26 to a cheaper one. The unit is a spell at one club, so a January mover counts as two. Playing time is the share of games he started out of those his club played while he was there and not injured, using Transfermarkt injury dates against the fixture list. That lets a season lost to injury stay in: a player who missed half a year has a smaller denominator, not a worse record. How expensive a squad is means what it would cost to buy, counting its most valuable players; using the whole squad changes nothing. Squads are priced on 1 August for the history and on today’s valuations for the board. A player only enters if he started at least half the games available to him beforehand, and without that floor the effect disappears: a fringe player who drops a level to play every week is escaping this rather than paying it. There is no comparison group of players who stayed put, so read the gap between moving up and moving down rather than either number alone. Draft positions are the current Fantrax average, and these are games and points players actually produced, not a projection of anyone’s next season.